System Hub
Administrators use System Hub to manage various tracking and security features in
System Hub is organized as follows:
- Auditing drawer
- System Usage drawer
- System Settings
Open System Hub
- Click the logo at the top-left corner and select System Hub.
Login Events
Note: If your FP&A is running on Prophix One Portal, no user-related functions are available in Security Manager; all user-management tasks are performed in Portal.
Administrators use Login Events to monitor system security by tracking the following events:
- Invitation sent*
- Login
- Sign-out
- Failed login
- Password forgotten*
- Password changed*
- Authorization access error (a user attempts to do something but lacks the necessary permission)
Note: *Event excluded if using Windows Authentication or SAML.
Use Login Events
- Open System Hub.
- In the Auditing drawer, select Login Events.
- To see a summary dashboard of login events for last 15 days, select Summary.
- In Summary, you can do the following:
- To filter the events in Details for any event named in the badges, click the badge.
- To filter the events in Details for logins or sign-out for a given date, in the chart click the corresponding bar.
- To filter the events in the chart, click a legend square on/off.
- To see all events, select Details.
- In Details, you can do the following:
- To sort/filter on any column, click .
- To turn off a filter, click Reset.
- To save the data to an Excel file, click .
- To see the cause of a Failed login, click .
Object History
Object History tracks all manual changes made to an "object", recording the who, what, and when of each change.
What is an object?
Generally, it's anything that you can work on in
Note: At this time Object History contains the Security Manager node. The scope of Object History will expand with future releases.
See the history for an object type
- Open System Hub.
- In the Auditing drawer, open the Object History node.
- Open the sub-node that contains the object type (for example, Security Manager).
-
Select the object type (for example, Users, Groups, or Roles).
The change history appears in the main panel.
- To force an update, click Refresh.
-
Optionally, you can sort and filter on the columns.
Compare two versions of an object
-
Select two rows that belong to the same object. (To select non-adjacent rows, use Ctrl + click.)
Tip: Rows that belong to the same object always have the same ID value.
-
Click .
The Object Comparison dialog opens:
- The left pane shows the older version, the right shows the newer.
- Deletions appear struck out in the left pane.
- Additions appear in green in the right pane.
Audit Log
The Audit Log tracks user actions in core areas, recording who did what and when and with what resources. If a problem occurs, Admins can use these detailed records to review events and thus more quickly identify solutions.
Additionally, Admins can download the log to an Excel file to help Prophix Support to analyze the problem.
The Audit Log data
The event data presented in the Audit Log grid is as follows:
-
Area: The module where the event took place.
Audit Log tracks activity in the following Areas: Ad Hoc Analysis, Model Manager, Process Manager, Detailed Planning Manager, Template Studio, and Template Runtime.
-
Category: A sub-area, object, or function belonging to the Area.
For example: Member within Model Manager, Import and Infoflex within Process Manager, Template within Template Runtime, Administration in Detailed Planning Manager.
-
Resources: The name of the affected object or its location.
For example: Finance Model, DPM, Public\Templates\Personnel, Finance Model > Accounts > (Ast) Asset.
-
Event: The action the user took.
For example: Create Template, Add Schedule, Attempt To Open Template, and so on,
- User: The name and email of the user who took the action.
- Date: The date and time of the event.
-
Message: A longer and more specific description for the Event.
For example: If Event is Template Open, Message might be "Revenue Variance Report" was opened.
Tip: To see all the options for Area, Category, or Event, click for that column; a complete list of options appears under Filter by.
Use Audit Log
- Open System Hub.
- In the Auditing drawer, select Audit Log.
- Do any of the following:
For columns that allow sorting, click and select a sort option.
(The default sort order is on Date, descending.)
- For columns that allow filtering, click and select the Filter by options you want to include.
To filter on the Resources column, in Filter by type some text that you know appears in the Resources cells.
Tip: You can filter on more than one column at a time.
- To turn off a filter, click and click Clear.
- To turn off all filters, click Reset.
- To refresh the data, in the toolbar click .
- For cells with truncated content, to open the content in a popup click .
To download the current data set to an Excel spreadsheet, in the toolbar click .
The download starts and the file name appears at the bottom left corner of your browser and you can open the file or open its location.
Note: The maximum download size is 10,000 records.
Tip: To make analysis easier, before downloading, apply filters to narrow the data set to the areas, categories, and so on that are relevant to the problem.
Data History
If turned on for a model, Data History tracks all manual changes made to a member combination through any of the following:
- Ad Hoc Analysis
- a data-entry template
- line item schedules
- a trigger account for a procedural calculation account (an entry is logged in the history of each affected account)
- a linked detailed planning schedule
- a journal entry
Turn on Data History for a model
- Open System Hub.
- In the Auditing drawer, select Data History.
- Select each
See a member combination's history
You can open a combination's data history in Ad Hoc Analysis or a template (in both data-entry and report modes).
-
Right-click the cell and select Data History.
See changes made through journal entries
In the data history, under Details, you can click a link that opens the relevant entry or entries in the Journal Entry dialog's Journal Details tab.
To learn more, see Journal Audit History.
Data History FAQ
What does Data History record?
Basically, the who, what, and when of all manual changes to a combination.
How long is a data history kept?
If you delete the
Is Data History enabled by default?
An admin must turn on Data History for a
Active Sessions
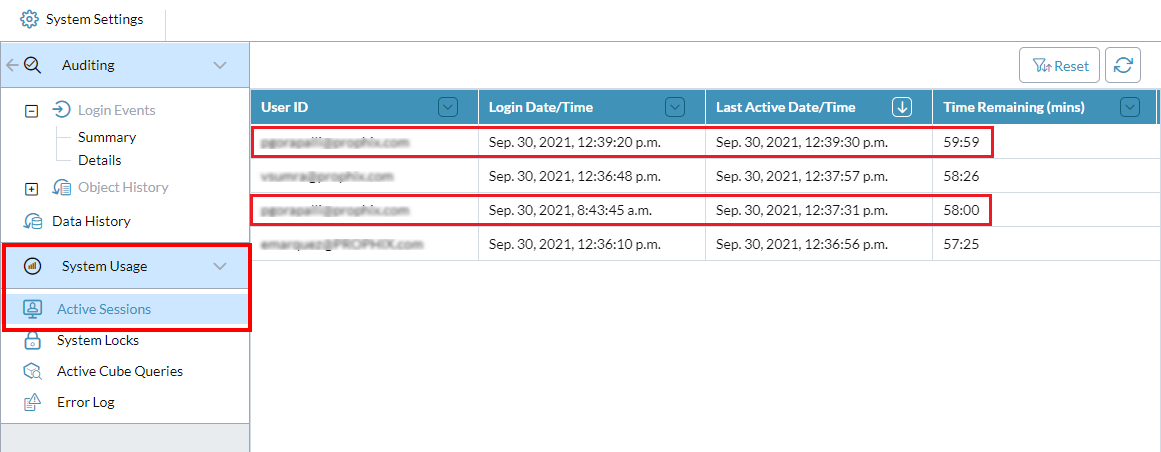
Global and security admins can see a list of the users currently signed-in to FP&A and details of their sessions: when the session started, when the session was last active, and time remaining in the session (based on the Session Timeout setting). Users are listed in Active Sessions until they sign out of FP&A or until their session times out and they are automatically signed out by the Session Timeout feature.
Note: Closing the browser does not end a session. To end a session manually, the user must sign out of FP&A.
To see the active sessions in FP&A
- Open System Hub.
- In the System Usage drawer, select Active Sessions.
- You can do any of the following:
- To sort on any column, click .
- To reset the sort settings Reset.
- To refresh the data, click .
Note: It is possible for the same user ID to appear under multiple sessions. For more information, see the FAQ that follows.
Active Sessions FAQ
What is a FP&A session?
A FP&A session is created each time a user signs in to FP&A.
What are "active sessions"?
The term "active sessions" refers to all open sessions. That is, the users have not signed out, or the timeout feature has not yet signed the users out.
Example: Even if a user closes the browser window and then immediately opens a new browser window and signs in again, Active Sessions shows both sessions; even though the user has no way of accessing the first session, FP&A considers it an "active session".
What keeps a session "active" is server calls (sending data to or receiving data from the FP&A server) more frequently than the specified session timeout value. Each time a server call is made, the value in Last Active Date/Time is updated, the Time Remaining (mins) value is reset, and the countdown is restarted.
A simple scenario to explain the mechanics of active sessions:
- The admin has set Session Timeout to 60 minutes.
- A user signs in to FP&A and opens some modules (for example, Ad Hoc Analysis and Report Binder) and accesses data from the server.
- All this activity involves server calls and therefore the countdown constantly resets to 60 minutes.
- The user then goes into a meeting for 50 minutes; the countdown runs down to 10 minutes.
-
At the end of the meeting the user selects the Ad Hoc Analysis tab and refreshes the data view; the countdown resets to 60 minutes.
Note: To keep a session active, the user only has to cause a server call in any one module; all the open FP&A tabs in a browser count as part of the session.
Sever calls are indicated whenever the red spinner appears on the screen:

What user actions cause server calls?
Many common actions in FP&A require server calls that either send data to the server or pull data from it. For example:
-
Saving changes on a screen (for example, saving a data view in Ad Hoc Analysis).
- Viewing cell properties in a data view in Ad Hoc Analysis.
- Changing the layout of a data view using Edit Layout.
- Changing a member selection in Ad Hoc Analysis or Template Studio.
User actions that don't call the server
Some user actions don't cause a server call, even when they change data, because the changes are cached in memory until the user chooses to save them. For example:
- Modifying cell formatting in a template
- Modifying cell values in a template
There are also many user actions that never require the browser to send or receive data; for example:
- Expanding or collapsing the left panel in Template Studio
- Expanding or collapsing drawers in the left panel in Template Studio
- Scrolling in a template page
- Clicking on cells in a template
Can a user open multiple sessions?
Yes. A user can have multiple sessions running at the same time. In System Hub, multiple sessions appear as multiple rows for that user ID; for example:
Multiple sessions running for the same user can happen for various reasons. Some examples:
- The user signs in to FP&A from two different browsers (for example, Chrome and Edge).
- Active Sessions shows two sessions for the user.
- The user signs in to two different browsers (for example, Edge and Chrome), closes the windows without signing out, then immediately opens two new windows in two different browsers and signs in again.
- Active Sessions shows four sessions for the user.
- The user signs in to FP&A from a browser, and signs in from one of the Excel add-ins (Analyzer or Contributor).
- Active Sessions shows two sessions for the user.
Are a user's multiple sessions independent of one another?
Yes. All the rows that appear in Active Sessions— even when they belong to the same user ID— represent completely independent sessions.
- A user has two sessions running: Session A and Session B. (Both appear as rows in Active Sessions, with the same user ID.)
- In Session B, the user has a data view open in Ad Hoc Analysis and is making changes to the data.
- Meanwhile, Session A is inactive.
- Eventually, in Session A the countdown starts.
- The user continues to work in Session B and ignores the countdown.
- Session A times out, and the user is automatically signed out of Session A.
- Session B remains open and the user continues working. (Active Sessions now shows only one session for this user.)
- A user has two sessions running in browsers, Session A and Session B, and a third session in Analyzer, Session C. (All three appear as rows in Active Sessions, with the same user ID.)
- In Session A and Session B, the user has data views open in Ad Hoc Analysis but is not performing any actions.
- In Session C, the user is editing a data view with Excel.
- Eventually, in Session A and Session B the countdowns start.
- In Session A, the user ignores the countdown, allows the session to timeout, and is signed out of it.
- In Session B, the user cancels the countdown, and the session continues for now.
- At this point, Session B and Session C remain open. (Active Sessions now shows two sessions for this user.)
System Locks
Administrators use the System Locks to manage locking in FP&A.
Any software system that is shared among concurrent users employs locking to ensure that only one user at a time can make changes in a given area.
Open System Locks
- Open System Hub.
-
In the System Usage drawer, select System Locks.
Tip: You can sort on any column. Also, if the tab has been open for some time, you can refresh the data by clicking .
Release a single lock
-
Select the row and click Clear Lock.
Release all the locks belonging to one user
-
Select any row belonging to the user and click Clear All Locks For User.
Release all locks
-
Click Clear All Locks.
Note: In certain situations where a user has caused a self-lockout, FP&A presents the user with the opportunity to take over the lock.
Active Cube Queries
Global Administrators can use Active
End a long-running SSAS query
A Global Administrator can terminate any query that is deemed to have run too long. The termination is recorded in the Error Log.
- Open System Hub..
- In the System Usage drawer, select Active
- Select the query.
- Click (Terminate Query).
View a query's script
A Global Administrator can examine a query's script and copy it.
- Select the query.
-
In the Query column, click .
The Query Details dialog opens.
-
(Optional) Click Copy.
Error Log
Admins use the Error Log to monitor the system errors that users encounter.
To use the Error Log
- Open System Hub.
- In the System Usage drawer, select Error Log.
- You can do any of the following:
- To sort/filter on any column, click .
- To turn off a filter, click Reset.
To save the log data to an Excel file, click . (You can save up to 10,000 rows.)
The resulting file is Error Log Details.xlsx.
- To see the details of an error, click .
- To copy the details text to the clipboard, click Copy.
Session Timeout
Note: If your FP&A is running on Prophix One Portal, the Session Timeout feature is unavailable. In Portal, the Session Timeout is preset.
Global Administrators can set the maximum length of time a user session can run without activity. When the timeout limit is reached, the user's session ends and the user is automatically signed out.
The Session Timeout feature helps prevent overnight processes from failing due to data locks left in place because their users forgot to sign out.
The Session Timeout feature functions as follows:
-
At 15 minutes before the automatic sign-out, a message appears on the user's screen along with a countdown clock:
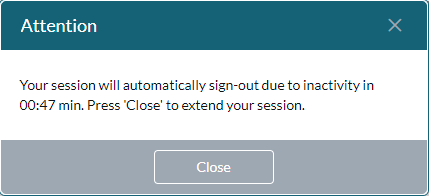
- If the user clicks Close, the countdown ends and the session clock restarts.
- If the user allows the session to run out, another message appears explaining that the user was automatically signed-out for inactivity.
- When the user closes this message, the screen shows a "good bye" page from where the user can sign-in again.
The default value for Session Timeout is 60 minutes. The available values range from 30 to 180 minutes.
Note: The Session Timeout feature applies to Excel add-ins as well. However, users of Contributor and Analyzer aren't shown a warning message and the countdown clock.
To set the timeout value
- Open System Hub.
- In the menubar, click System Settings.
- In the Session Timeout tab, from Auto sign-out inactive sessions after select a minutes value.
- Click Save.
Note: Changing the Session Timeout value does not affect any sessions currently running.
Data Precision
Global Administrators can activate and specify the Data Precision setting, which applies to all numeric data in
By default Data Precision is turned off.
To use Data Precision
- Open System Hub.
- In the menubar, click System Settings.
- In the Data Precision tab, turn on Round
- Set the value you want in Number of decimal places to round values to.
-
Click Save.
Note: The new rounding value immediately takes effect on all model queries.
When to use the Data Precision option
You should only turn on Data Precision if you are experiencing problems with inexact data values.
Example: A member combination that you expect to return a value of 23.18 instead returns a value such as 23.180000000001 or 23.17999999997. Setting Number of decimal places to round values to at 2 returns 23.18.
The default settings
- The default setting for Round cube data is off.
- The default value for rounding is 2 (We believe this setting will work best for most customers). The range is from 0 to 10.
How to choose a custom setting
If you need to use a custom value for Data Precision, you can determine the maximum rounding value as follows:
- Estimate the largest number you expect a model to return, and count the places to the left of the decimal.
- Deduct the number of places from 14; this gives your maximum rounding value.
Example: If the largest value you expect a model to contain is 9.99 billion (9,990,000,000), the number of places is 10 and your maximum rounding value can be 4 (14 - 10 = 4).
Example: If the largest value you expect a model to contain is 999 billion (999,000,000,000), the number of places is 12 and your maximum rounding value can be 2 (14 - 12 = 2).
Why the Data Precision option is needed
To better understand why some users may need to enable the Data Precision option, it is necessary to understand two concepts: significant digits and data precision.
What significant digits are
The term significant digits refers to all non-zero digits in a value (but includes any zeroes located between non-zero digits).
Note: Both integers and decimals count as significant digits.
Example: The value 1234567890.7654321 contains 17 significant digits, seven of which follow the decimal.
What double precision is
SQL Server Analysis Services (SSAS) stores data values as double precision. This means that the values are accurate to the first 14 significant digits. However, not all possible double precision values can be 100% accurately represented in Binary. As a result, it is possible for a value such as 23.18 to be returned as a very close approximation, but slightly different after the 14th significant digit.
Significant digits and double precision
Caution: The main thing to understand is that there is no situation where more than 14 significant digits can be stored and reported accurately. The Data Precision setting you choose is always be applied to all model values, and that means you need to understand the size of the largest value in your model.
If we store a value of 14 or fewer significant digits as double precision, there is no problem. The value remains accurate.
If we store a value of more than 14 significant digits as double precision, the extra digits essentially become random numbers, and inaccuracies are introduced. This normally happens for a database value that is the result of calculations or aggregations.
Example: If we store 1234567890.7654321 (17 significant digits) using double precision, it will only be accurate to a value of 1234567890.7654; in effect, we are not storing the original value.
Example: If we store 123456.7890765 (13 significant digits) using double precision, it will remain accurate, even though it contains as many decimals as the previous example.
Effect on reporting
This slight inaccuracy of stored values usually doesn’t cause any problems and is in fact normally invisible in financial reports that have any type of numeric formatting applied (except General). The numeric formatting in the first example above will always return the expected value of 23.18 provided formatting is applied that doesn’t attempt to show more than 12 decimal places.
Where this issue may become evident is when a calculated value is expected to equal zero, but in fact ends up being a value that is near-zero (but not exactly equal to zero). For example, the value returned from the database is 0.0000000000004, and you have a report that uses the following options:
- Display zero values as missing
- Display missing data as – set to a user-defined symbol, for example a hyphen (-)
When the report tries to display the value, instead of the expected hyphen (-) you may see 0 or ((0) if the value is slightly negative).
How the Data Precision option solves the problem
If you choose to turn on Data Precision, every data value retrieved from a model is rounded to the value you specified in Number of decimal places to round values to before being passed to any modules such as Ad Hoc Analysis or data-entry/reporting templates.
Returning to the two preceding examples, the following table show the effect of two different rounding values:
| Original value | Rounding value | Rounded result |
|---|---|---|
| 1234567890.7654321 | 2 | 1234567890.771 |
| 123456.7890765 | 2 | 123456.791 |
| 1234567890.7654321 | 6 | 1234567890.7654xx2 |
| 123456.7890765 | 6 | 123456.7890773 |
1The rounding is accurate because it is performed on the first 14 or fewer significant digits.
2In this case the rounding is problematic; "xx" represents two random digits. If either of these digits is 0, neither will be shown. The "xx" digits were added back because the original value was 17 significant digits, the last three of which were lost when stored; we have specified 6 decimal places, but only 4 decimal digits are now available to fill them.
3The rounding is accurate because the original value was less than 14 significant digits.